Nielsen has launched the first update to its Nielsen App Playbook study, and to celebrate they’re sharing some of the data for free.
The most recent version of the study has just been released and it is based on an August 2010 survey of more than 4,000 US mobile subscribers who had reported downloading a mobile app in the previous 30 days.
Facebook is the king of apps
Games continue to be the most popular category of apps for both feature phone and smartphone users alike. Sixty-one percent of smartphone owners and 52% of feature phone owners report using a game app in the past 30 days. Weather apps are the next most popular category.
When it comes to the popularity of individual apps, Facebook reigns supreme on all smartphone operating systems. The most used apps are popular among users of all operating systems, although there are a few minor differences:
Twitter is among the top five only on the BlackBerry, perhaps because the device’s keyboard is optimized for typing. And while YouTube is popular on Android and Windows Mobile, it doesn’t make the top five on the iPhone or BlackBerry operating systems. Naturally, iPod/iTunes is popular only among iPhone users.
How we discover apps
Searching application stores on their phones is the preferred way for discovering new apps for users of feature phones and smartphones alike (57% and 40%, respectively). The next most popular “preferred” form of app discovery is through the recommendation of a family member or friend. However, smartphone apps users are more likely than feature phone users to seek out other ways of discovering new mobile apps.
Ratings and reviews are also valuable tools in deciding which apps are downloaded: 18% of all apps downloaders say ratings and reviews are “extremely important”, 36% say they are “very important,” and 34% say they are “somewhat important.”
Happy-ish to have advertising
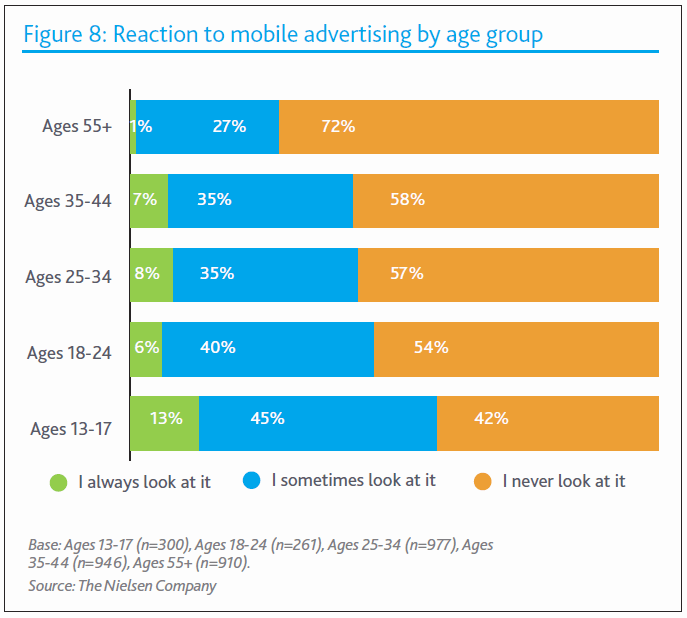
Mobile advertising is increasingly finding its way into mobile apps, with teenagers being much more receptive than their elders. Fifty-eight percent of teens say they “always” or “sometimes” look at mobile ads. In general, men of all ages are more receptive to mobile ads than women. Only 37% of men say they are not at all likely to respond to an ad on a mobile device, compared to 44% of women.
Across all operating systems, apps users would prefer to view mobile ads within an app. Android users are more likely to click on an advertisement within an application, while iPhone users are the least interested in having ads take them outside of their application.
Approximately one-in-five apps users say they have used a search engine or looked elsewhere online for more information after viewing a mobile advertisement or told someone about the advertised product or service. Seventeen percent have forwarded a link or video to others and 10% have recommended an advertised product or service. Sixteen percent have used a coupon and 14% have entered a contest or sweepstakes.
The augmented future
The Nielsen study finishes with a look at the future of apps. They conclude that while it’s a very young market there remains plenty of room for innovative newcomers, and new categories will emerge with applications we have yet to imagine. And the category they think will be important and worth watching is augmented reality.
For more on the study click here
[ad name=”Google Text half banner advert “]
